

Most real estate agencies running Google Ads in Australia are staring at the wrong numbers. They check impressions, feel good about traffic, and miss the metrics that actually connect ad spend to signed listings and settled deals. Google Ads reporting for real estate Australia is not about vanity data. It is about understanding exactly which clicks turn into appraisal requests, buyer enquiries, and vendor leads. This article breaks down the metrics that matter, the ones that mislead, and how to read your reporting like a practitioner rather than a passive observer.
Table of Contents
- Why Standard Metrics Mislead Real Estate Agencies
- Quick Takeaways
- The Metrics That Actually Matter for Real Estate Google Ads
- Understanding Quality Score in Real Estate Campaigns
- Comparing Reporting Approaches for Real Estate Agencies
- Conversion Tracking Setup for Real Estate
- Reading Search Term Reports the Right Way
- Remarketing and Display Metrics for Real Estate
- Frequently Asked Questions
- References
Why Standard Metrics Mislead Real Estate Agencies
Google Ads produces an enormous volume of data. The problem is that most of it is irrelevant to a real estate agency unless it has been filtered through the lens of your actual business goals. A suburban agency in Brisbane chasing vendor leads has completely different reporting priorities than a commercial property firm in Sydney’s CBD.
The data consistently shows that agencies who optimise for clicks alone routinely waste 30 to 50 percent of their monthly ad budget on traffic that never had any intent to list or buy. Clicks are not leads. Impressions are not brand awareness. A 5 percent click-through rate means nothing if your conversion rate is 0.3 percent.
In practice, the first thing any experienced Google Ads practitioner does when auditing a real estate account is ignore the headline numbers and go straight to conversion data and search term reports. Those two areas tell the real story.
Quick Takeaways
| Key Insight | Explanation |
|---|---|
| Cost per lead is your primary KPI | Not cost per click. For most Australian real estate agencies, a realistic target CPL for vendor leads is $30 to $80 depending on suburb and competition. |
| Conversion tracking must be property-specific | Track appraisal form fills, phone calls, and live chat starts separately. Grouping them hides which ad types drive the highest-intent actions. |
| Impression share reveals competitive pressure | If your search impression share drops below 40 percent in your target suburbs, a competitor is outbidding or outrelevancing you for those searches. |
| Search terms report is non-negotiable | Review it weekly. Real estate searches include irrelevant modifiers like “free”, “DIY”, and suburb names outside your service area. Negative keywords save budget fast. |
| Quality Score affects your cost per click directly | A Quality Score of 7 or above means you pay less per click than competitors with lower scores. Ad relevance and landing page experience are the two levers most agencies ignore. |
| Remarketing metrics need separate benchmarks | Display and YouTube remarketing campaigns have lower CTRs by design. Judging them on the same CTR benchmark as search campaigns is a category error. |
| View-through conversions are unreliable for attribution | Google counts a conversion if someone saw a display ad and later converted, even without clicking. Do not inflate your ROAS figures by including these uncritically. |
The Metrics That Actually Matter for Real Estate Google Ads
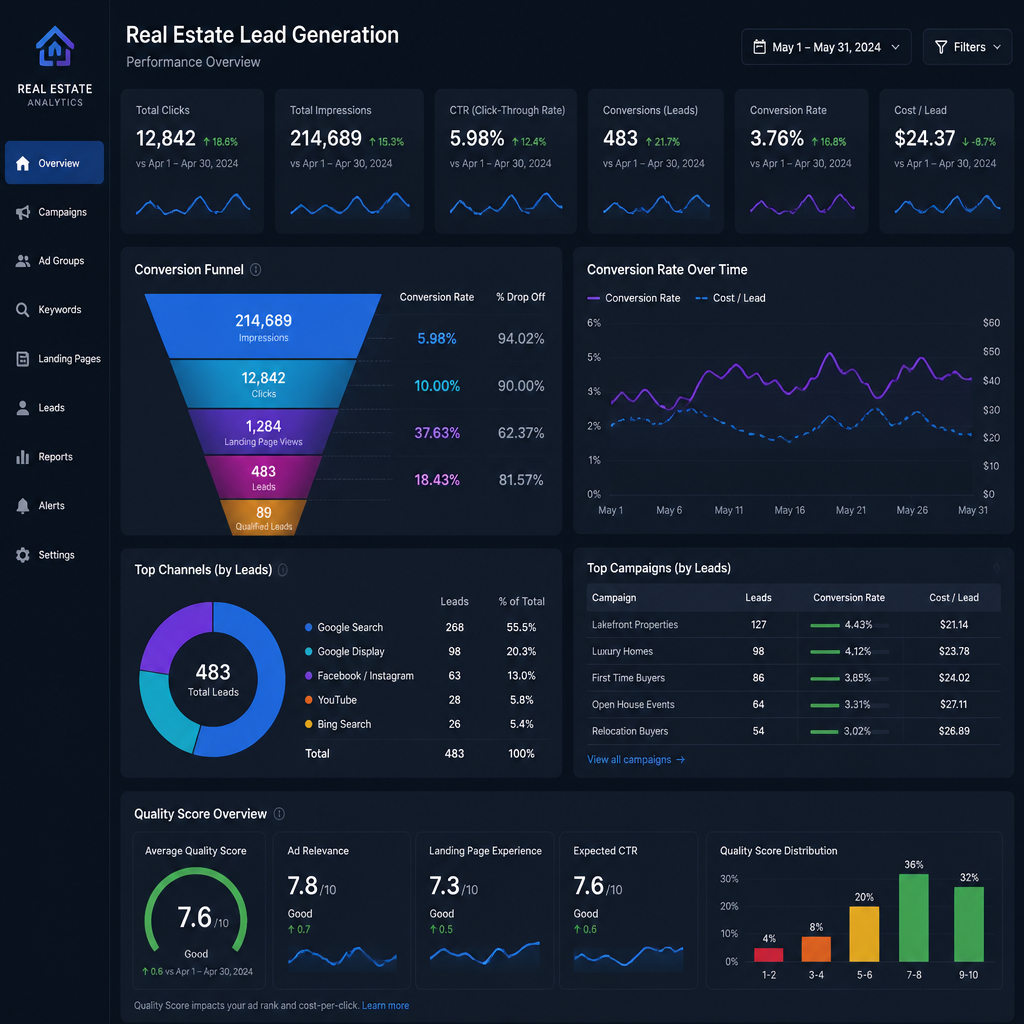
Strip away the noise and you are left with six core metrics that drive real estate advertising decisions. Every other data point either supports these six or is irrelevant to your monthly reporting review.
Cost Per Lead (CPL)
CPL is the single most important number in any real estate Google Ads account. Calculate it by dividing your total ad spend by the number of genuine enquiries generated. In practice, a well-managed search campaign targeting vendor appraisal requests in metropolitan Australia should produce leads between $35 and $90 each, depending on how competitive the postcode is.
If your CPL is climbing above $150 for standard residential enquiries, something structural is wrong: your bids, your targeting, your landing page, or your keyword match types.
Conversion Rate by Campaign Type
Search campaigns typically convert at 3 to 8 percent for real estate landing pages. Display campaigns convert far lower, often under 1 percent. Treating these the same in a blended report is a common mistake that causes agencies to cut the wrong campaigns or keep the wrong ones running.
Separate your reporting by campaign type. A display campaign with a 0.4 percent conversion rate is not failing. A search campaign with a 0.4 percent conversion rate almost certainly is.
Click-Through Rate (CTR) by Ad Group
CTR in real estate Google Ads search campaigns should sit at 5 percent or above for branded and suburb-specific ad groups. Generic terms like “real estate agent” typically see lower CTRs of 2 to 4 percent. Below these thresholds, your ad copy is not matching searcher intent well enough.

Impression Share and Lost Impression Share
This metric tells you how often your ads appear compared to how often they were eligible to appear. A lost impression share due to budget means you are capping your own reach. A lost impression share due to rank means competitors are beating your Quality Score or bid. Both require different fixes.
For local suburb targeting in Australian real estate, aim for at least 60 percent impression share on your highest-priority keywords. Dropping below 40 percent in a key postcode is a competitive red flag.
Average Position and Top Impression Rate
Google removed average position as a metric in 2019. The replacement metrics, specifically Search Top IS (percentage of times your ad appeared in the top positions) and Absolute Top IS (percentage of times your ad appeared in position one), are more useful for real estate because they reflect actual page placement rather than a weighted average.
Target 70 percent Search Top IS for your vendor-lead campaigns. Appearing below the fold on mobile is a conversion killer for property searchers who want immediate contact options.
Understanding Quality Score in Real Estate Campaigns
Quality Score is Google’s 1-to-10 rating of how relevant your keyword, ad, and landing page are to each other. A higher score means lower cost per click and better ad placement. For real estate agencies, this is where most campaigns bleed money silently.
Expected Click-Through Rate
Google compares your ad’s historical CTR against competitors using the same keyword. If your ad for “real estate agent Brisbane Northside” has a poor expected CTR, it means your headlines are not compelling enough relative to what others are showing. A common mistake here is writing generic headlines like “Your Trusted Local Agent” when searchers respond better to specifics: suburb names, transaction volumes, or fee transparency messaging.
Ad Relevance
Your ad text must closely mirror the keywords triggering it. Running a single ad across a broad ad group with twenty loosely related keywords tanks ad relevance. The fix is tighter ad groups, ideally one to five keywords per group, all pointing to ad copy that reflects exactly what that keyword describes.
Landing Page Experience
This is the most underestimated Quality Score component in real estate campaigns. Sending traffic from a “property management fees” keyword to a generic homepage is a landing page experience failure. Google measures page load speed, mobile usability, and content relevance. HubSpot reports that landing pages with a single focused call to action convert at rates up to 266 percent higher than pages with multiple competing offers.
“The single biggest lever agencies have to reduce Google Ads costs is landing page relevance. Most real estate agencies are paying a Quality Score tax every day because their pages were built for branding, not conversion.” – Practitioner insight from AusPromotion’s campaign audit process
Pro tip: Create a dedicated landing page for each core service: vendor appraisals, buyer enquiries, property management, and off-market listings. Never send paid traffic to your homepage if you want to control Quality Score and conversion rates simultaneously.
Comparing Reporting Approaches for Real Estate Agencies
Real estate agencies generally fall into three reporting approaches when managing or reviewing Google Ads accounts. Each has different implications for decision-making quality and budget efficiency.
| Reporting Approach | What It Tracks | Best Suited For |
|---|---|---|
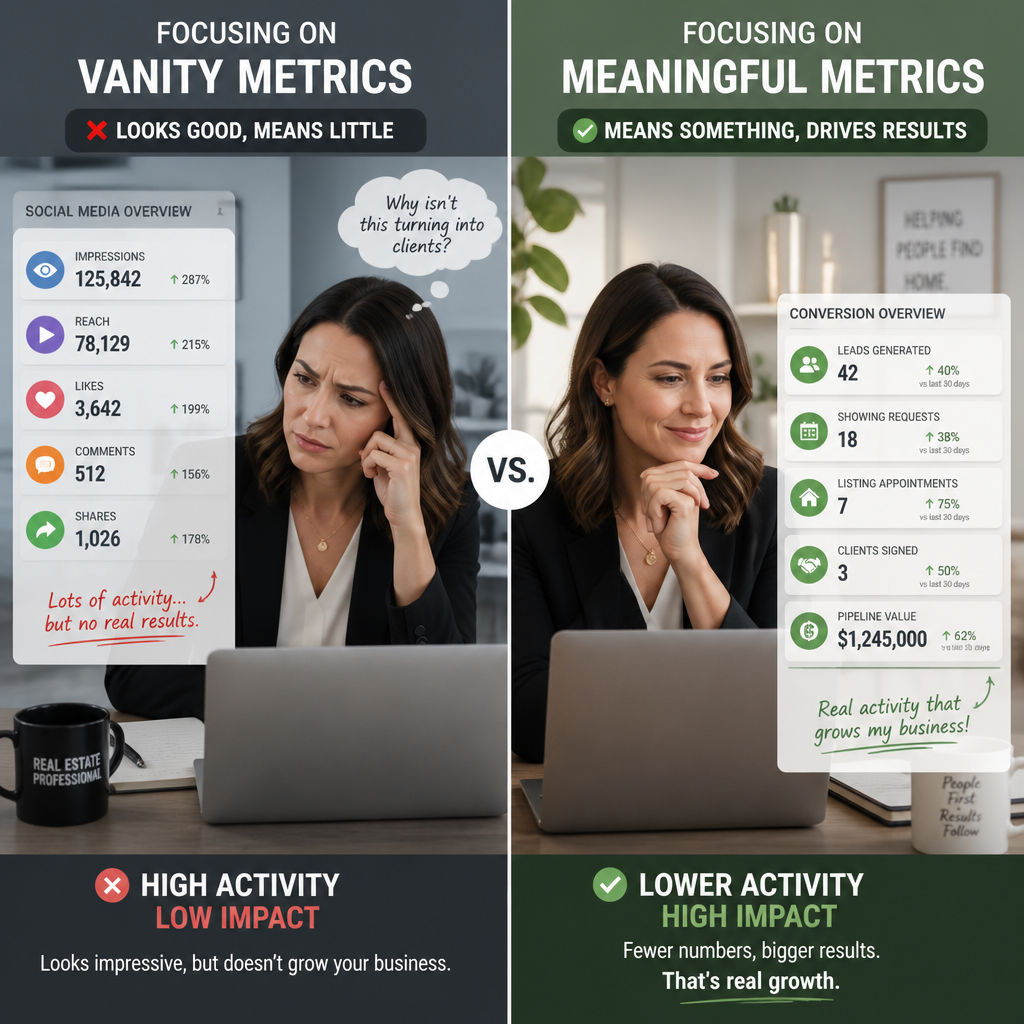
| Vanity Metric Reporting | Impressions, clicks, CTR only. No conversion tracking configured. Monthly PDF with chart screenshots. | Nobody. This approach wastes budget and produces no actionable data for real estate performance. |
| Conversion-Focused Reporting | CPL, conversion rate by campaign, search term analysis, impression share, Quality Score components. Reviewed weekly. | Agencies running consistent monthly ad budgets of $1,000 to $5,000 who need to tie spend directly to appraisal bookings and enquiries. |
| Full-Funnel Attribution Reporting | All conversion-focused metrics plus cross-channel attribution, lifetime client value tracking, and remarketing audience performance segmented by buyer versus vendor intent. | Larger agencies or franchise groups with multi-suburb targeting, blended search and display budgets, and CRM integration for lead tracking beyond the first click. |
In practice, most Australian real estate agencies should be running conversion-focused reporting from day one, not graduating to it after months of vanity metric tracking. The tools to do this properly, including Google Tag Manager, Google Analytics 4, and Google Ads conversion tracking, are all available without additional cost.
Conversion Tracking Setup for Real Estate
If your Google Ads account is not tracking conversions properly, every metric you review is meaningless. You cannot optimise what you cannot measure. A common mistake is marking only one conversion action, typically a contact form submission, and missing phone calls, live chat starts, and click-to-call events from mobile ads.
The Four Conversion Actions Every Real Estate Account Needs
First, form completions on appraisal request pages, buyer registration pages, and rental enquiry pages. Each should be tracked separately so you know which ad types drive which intent.
Second, phone call conversions using Google’s call tracking, configured to count calls lasting more than 60 seconds. Shorter calls are often misdials or directory lookups. Third, click-to-call button taps from mobile search ads. These fire before the call connects and indicate mobile intent even if the call is not completed. Fourth, chat or callback widget engagements if your real estate website uses live chat tools like Tidio or Drift.
Setting Conversion Values for Real Estate
Google’s Smart Bidding strategies work better when you assign realistic values to conversions. For a real estate agency, an appraisal form submission might have an estimated value of $500 to $2,000 depending on your average commission and listing conversion rate. Assigning these values allows Google’s algorithms to bid more aggressively for high-value conversion opportunities and back off on lower-intent searches.
Pro tip: Use Google Tag Manager to fire conversion events rather than hard-coding them into your website. This makes it far easier to update or add tracking without a developer each time your forms or landing pages change, which happens frequently in active real estate campaigns.
Reading Search Term Reports the Right Way
The search term report shows the actual queries that triggered your ads, as opposed to the keywords you bid on. For real estate agencies, this report is where budget leaks are found and stopped. The data consistently shows that accounts without active negative keyword management waste between 20 and 40 percent of their budget on irrelevant traffic within the first 90 days of a campaign.
Common Irrelevant Search Terms in Real Estate Campaigns
Australian real estate campaigns regularly attract searches for rental assistance, NRAS properties, government housing, real estate jobs, and real estate courses. None of these are potential clients. They need to be added as negative keywords immediately when they appear.
Geographic mismatches are equally costly. An agency targeting inner Melbourne suburbs will often attract searches from users in regional Victoria or interstate if match types are too broad. Suburb-specific negative keywords or tightly controlled phrase match targeting are the fix.
Using Search Terms to Find New Keywords
The search term report is also your best source of new keyword ideas. If you consistently see high-converting searches containing terms you are not explicitly bidding on, add them as exact match or phrase match keywords in a dedicated ad group with tailored ad copy. This consistently improves Quality Score and lowers CPL over time.
Remarketing and Display Metrics for Real Estate
Remarketing campaigns targeting past website visitors operate on completely different performance benchmarks than search campaigns. Measuring a remarketing display campaign against search CTR expectations will always make it look like it is underperforming, even when it is working exactly as intended.
Frequency and Reach for Real Estate Audiences
For real estate remarketing, frequency (the average number of times a unique user sees your ad) matters more than raw impressions. A frequency of 3 to 7 over a 30-day period is the practical target range. Below 3, you are not building enough recall. Above 10, you risk ad fatigue and negative brand association.
Reach, meaning how many unique users see your ads, should be monitored against your audience size. If you are only reaching 200 unique users per month with a remarketing campaign, your audience list is too small. Most agencies need at least 500 to 1,000 monthly website visitors to run meaningful remarketing campaigns.
View-Through Conversion Caution
Google’s default attribution includes view-through conversions in display campaign reporting. These are counted when someone sees your display ad but converts later via a different channel. In real estate, this inflates the apparent performance of display campaigns significantly. Always check your conversion column settings and make decisions based on click-through conversions as the primary metric, treating view-through data as directional context only.
YouTube advertising for real estate follows similar logic. Auspromotion runs YouTube video ad campaigns as part of multi-touchpoint strategies for agencies, and the primary metrics worth tracking there are view rate, cost per view, and the conversion rate of users who watched the ad versus those who skipped. These figures tell you whether your creative is compelling enough to hold attention before asking for a click.
Frequently Asked Questions
What is the most important Google Ads metric for a real estate agency in Australia?
Cost per lead is the single most important metric. It connects your ad spend directly to business outcomes: appraisal bookings, buyer enquiries, and rental applications. All other metrics, including CTR, impressions, and Quality Score, exist to help you understand why your CPL is what it is and how to improve it.
How do I know if my Google Ads campaign is actually generating real estate leads?
You need proper conversion tracking configured before you can answer this question. That means tracking form completions, phone calls over 60 seconds, and click-to-call events separately. If your account is only tracking clicks with no conversion actions set up, you cannot measure lead generation at all. Most Australian agencies running their own accounts are in this situation and do not realise it.
What is a good click-through rate for real estate Google Ads in Australia?
For search campaigns targeting suburb-specific real estate terms, a CTR of 5 percent or above is a reasonable benchmark. Branded campaigns (using your agency name as a keyword) should see CTRs above 10 percent. Generic competitive terms like “real estate agent Sydney” typically see CTRs of 2 to 4 percent due to high competition and diverse searcher intent. Display and remarketing campaigns have naturally lower CTRs, typically 0.3 to 0.8 percent, and should not be compared to search benchmarks.
How often should a real estate agency review its Google Ads reporting?
Weekly at minimum for active campaigns, with a deeper monthly review covering trend analysis, audience performance, and landing page conversion rates. Daily check-ins are useful in the first two to four weeks of a new campaign or after a significant change to bids or budgets. Looking at data daily after campaigns stabilise tends to produce reactive decisions based on statistical noise rather than genuine performance trends.
Should real estate agencies use Google’s automated reporting or build custom reports?
Automated reporting in Google Ads is useful for surface-level weekly data. For real decision-making, custom reports built in Google Ads reporting or connected to Google Looker Studio (formerly Data Studio) are far more useful because they let you combine campaign data with website analytics and filter by the specific metrics your agency actually cares about. A custom dashboard that shows CPL, conversion rate, impression share, and top-performing search terms in one view will always produce better decisions than navigating through default report tabs.
What is impression share and why does it matter for real estate agencies competing in the same suburbs?
Impression share is the percentage of total eligible impressions your ads actually received. If two agencies are targeting the same suburb keywords and one has 70 percent impression share while yours sits at 25 percent, you are essentially invisible to three quarters of the potential clients searching for your services in that area. Lost impression share due to rank means your Quality Score or bids need attention. Lost impression share due to budget means your daily cap is cutting campaigns off before the day ends.
Are Google Ads metrics for New Zealand real estate agencies different from Australian ones?
The core metrics are identical. CPL, conversion rate, Quality Score, impression share, and search term analysis apply equally in the New Zealand market. The main difference is scale. New Zealand markets are smaller, which means impression share targets and audience sizes for remarketing need to be calibrated to lower volumes. CPL benchmarks in New Zealand real estate also tend to be lower than in Sydney or Melbourne due to less competitive bidding environments, particularly outside Auckland.
Have you found a metric in your Google Ads reporting that surprised you with how much impact it had on your real estate campaign results? Share your experience below, we would like to hear what the data has shown you.
References
- HubSpot Marketing Statistics: landing page conversion rate benchmarks and digital advertising performance data
- Statista: Australian digital advertising spend and real estate sector online marketing statistics
- Ahrefs Blog: search intent analysis and keyword research frameworks relevant to paid search campaign optimisation
- Forbes: expert analysis on digital advertising ROI measurement and small business Google Ads strategy
- Moz Learn SEO: Quality Score, ad relevance, and landing page experience principles that apply across paid and organic search